
Project 2: How Many Lines? Now with bar graph! (code available on Github)
Scope:
Take the previous project (How Many Lines?) that just counts up the number of lines for each character in a Shakespeare play and displays them in a table. Add a bar graph to this, with effects like a tooltip that displays when you hover over a bar.
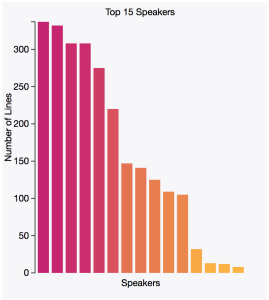
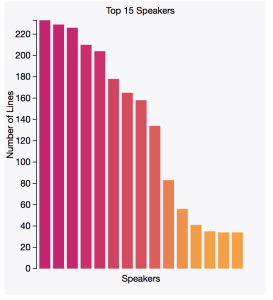
I used only the fifteen characters with the most lines for the bar graph, since otherwise I wound up with a feeble tail of multiple characters that only had a few lines, which made the graph (to my mind) less interesting.
What I Learned:
- D3.js! What a great library for data visualization. There are so many beautiful things you can do with it (for some stunning examples, check out the D3.js website), but I was pleased enough to get my bar graph up and running. The Lynda.com D3.js course was a useful resource to get familiar with the basic concepts of D3.js.
What I Left:
- The text styling in the tooltip isn’t great, but it displays the info I need it to.
A Few Interesting Notes on the Graphed Data:
It was fun to look at the graphed data for different plays to see how they compared. By and large, the comedies seem to have the most even distribution of lines: that is, the first three characters often have a similar amount of lines to speak.
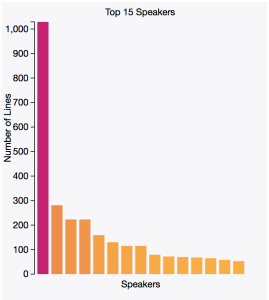
By contrast, the tragedies and histories tend to focus around one man who gets the lion’s share (50% or more!) of the lines. Compare Twelfth Night to Henry V!